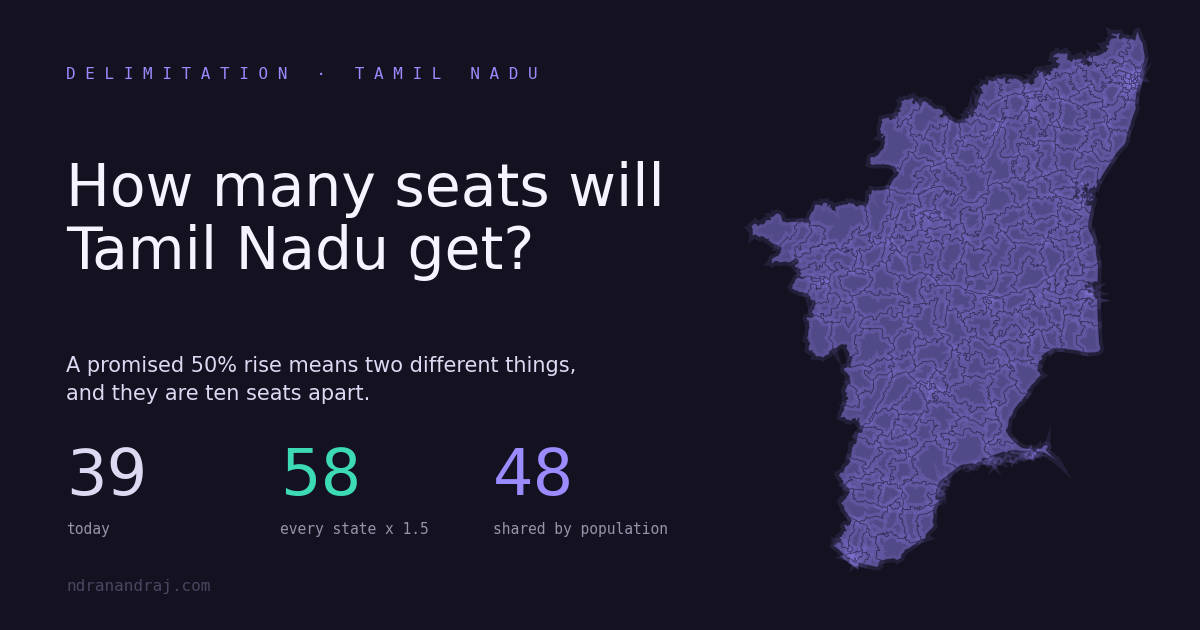
Tamil Nadu sends 39 members to the Lok Sabha. That number was fixed in 1976 and has not moved since, because Parliament froze seat allocation on the 1971 census and then extended the freeze twice.
The freeze runs out after 2026. A Constitution Amendment Bill to replace it was voted down in April, and a second attempt has been expected since, this time with an assurance attached: that every state’s seats would rise by 50 percent.
When that attempt comes is not settled. On 5 August it was reported that a special session would be called from 17 August. The same day, Parliamentary Affairs Minister Kiren Rijiju told ANI there was “no proposal to extend any dates of Parliament Session, no Special Session from August 16 to 18”. The monsoon session ended on 13 August without the bills being taken up.
So treat any specific date you read as unconfirmed. What is not in doubt is that the freeze expires, the arithmetic below does not depend on the timetable, and the numbers are what any future attempt will be argued over.
This piece works through each option on the table. It spends most of its time on that 50 percent, because the phrase is being used for two different proposals that are ten seats apart for Tamil Nadu.
Interactive Every number here, in a calculator Move the House size slider, switch the census and the rounding rule, and watch Tamil Nadu's seats change. Computed in your browser from published census counts.The short answer
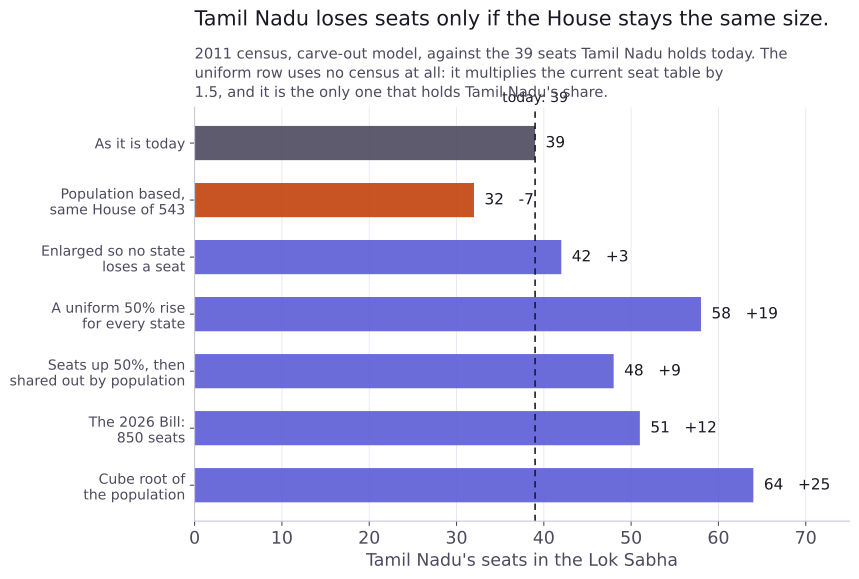
Tamil Nadu only loses seats if the House stays the same size. Every enlargement now on the table gives it more seats than it has today.
That is a fact about those proposals rather than about enlargement itself. If seats are shared out by population, Tamil Nadu does not get back to its present 39 until the House reaches 656, so a smaller enlargement would still leave it short.
Whether any of them protects Tamil Nadu’s share of Parliament is a separate question, and it has a different answer depending on which proposal you mean. That distinction is the whole argument, and the phrase doing the most damage to it is “a 50 percent increase”, which is currently being used for two incompatible things.
The options on the table, side by side
These use the 2011 census, which is the one the Bill names, on the 2011 territorial map, under the carve-out model explained in the method note. They are hypothetical: India has not moved seats between states since 1976.
| What happens | House size | Tamil Nadu | Change | TN’s share |
|---|---|---|---|---|
| Nothing changes | 543 | 39 | none | 7.18% |
| Seats recomputed on population | 543 | 32 | -7 | 5.89% |
| House grows until no state loses | 709 | 42 | +3 | 5.92% |
| Every state’s own seats multiplied by 1.5 | 806 | 58 | +19 | 7.20% |
| House up 50%, then shared out by population | 815 | 48 | +9 | 5.89% |
| The 2026 Bill as introduced | 850 | 51 | +12 | 6.00% |
| Cube root of the population | 1,066 | 64 | +25 | 6.00% |
The 2026 Bill raises the ceiling to 850 members, with up to 815 from the states and 35 from the union territories. It was introduced on 16 April and negatived on 17 April, 298 votes to 230, short of the 352 needed for a two-thirds majority.
The two rows in the middle are the ones to slow down on. They differ by ten seats, and in the current debate both of them are called a 50 percent increase.
What “a 50 percent increase” actually means
There are two versions in circulation and they are not variations on one idea. They are opposite answers to the question this whole argument is about.
Version one: multiply every state’s own seats by 1.5. Tamil Nadu’s 39 becomes 58. Uttar Pradesh’s 80 becomes 120. Kerala’s 20 becomes 30. Because every state grows by the same proportion, every state keeps the share of Parliament it holds today. Tamil Nadu stays at about 7.2%.
This is the version being described in public. NCP (SP) MP Supriya Sule offered conditional support for a delimitation bill on this basis in July, and said the formula had been put to an all-party meeting by Amit Shah and Kiren Rijiju. The TDP has backed it. Outlook’s explainer of the formula gives the same arithmetic I do: Tamil Nadu about 58, Maharashtra 72, Uttar Pradesh 120.
Version two: enlarge the House by about 50 percent, then share the seats out by population. Tamil Nadu gets 48. This is the column on the PRS bill tracker, and I rebuilt their model independently and got 48 as well, and 32 in their unchanged-House column.
Ten seats and 1.3 points of share separate them. If you have seen the promise of a 50% rise and assumed it meant Tamil Nadu keeps its weight in Parliament, you were reading version one. The published projections are all version two.
Which one would the law produce?
Version two. The Wire called the uniform version a statutory ghost, absent from the bills and inconsistent with them. I went and read the Bill, and the text bears that out:
- Article 81(2)(a) requires that seats be allotted so the ratio between a state’s seats and its population is “so far as practicable, the same for all States”.
- Section 8 of the Delimitation Bill, 2026 binds the Commission to determine each state’s seats “on the basis of the latest census figures and having regard to the provisions of articles 81, 82”.
- The Bill never names a census. Section 2(e) defines the latest census figures as those “published as on the date of the constitution of the Commission”, which on any near-term timetable means 2011.
You cannot hold that ratio equal across states and also hand every state the same percentage rise, because state populations have not grown at the same rate since 1971. A uniform increase is not a way of implementing the Bill. It is a different policy, and putting it into law would mean amending article 81(2) itself, not merely lifting the freeze that sits in article 82. That is a larger constitutional change than the one that was voted down in April, and I have not found a published draft of it.
What version one actually buys, and what it costs
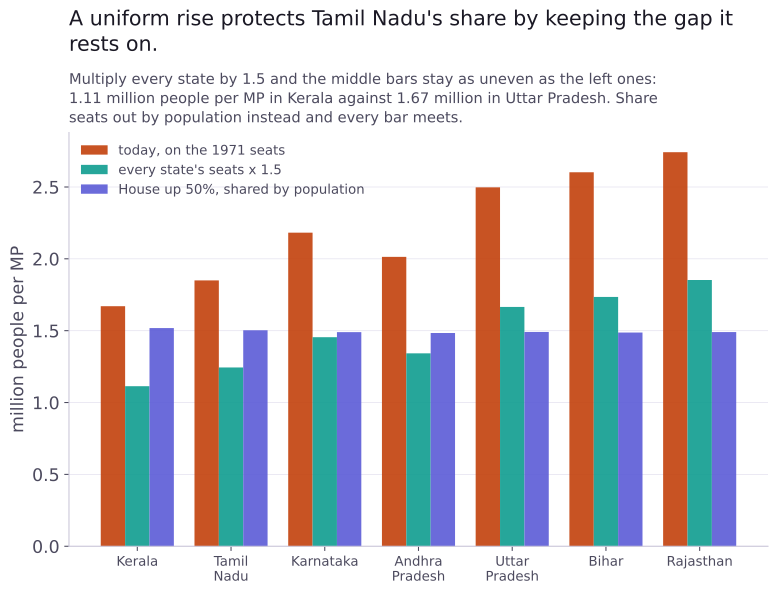
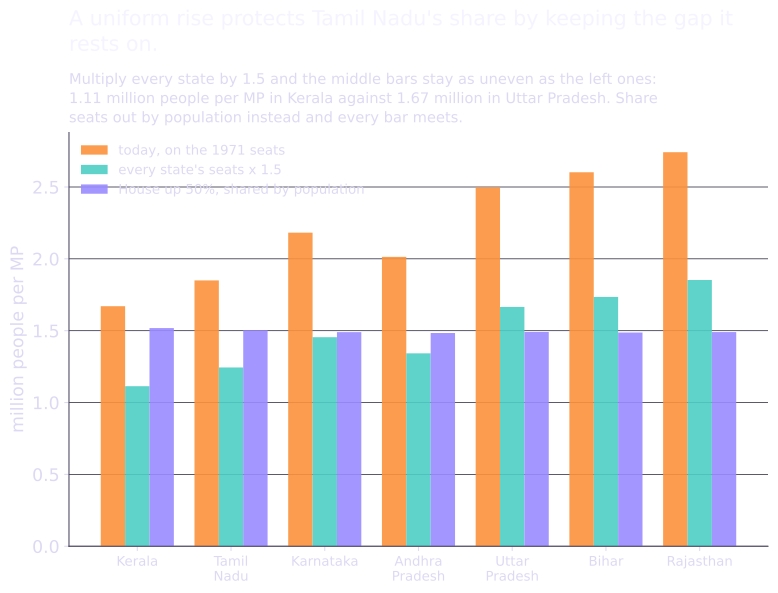
A uniform increase protects Tamil Nadu’s share, and it protects it by keeping the imbalance the share is made of.
Multiply everyone by 1.5 and a Kerala MP represents 1.11 million people while an Uttar Pradesh MP represents 1.67 million, a gap of about five and a half lakh per constituency. Those are The Wire’s figures, and my own calculation lands on the same two numbers. Both are unaffected by the rounding wrinkle below, since Kerala and Uttar Pradesh both hold an even number of seats.
The widest gap between large states does not close at all. It is 1.64 today, and between 1.62 and 1.66 after a uniform rise depending on how the half seats are settled, against 1.14 if the same number of seats is shared out by population instead.
So the choice is not between a fair option and an unfair one. It is between two different definitions of fair, and each buys one at the price of the other:
- Equal weight per state. Tamil Nadu’s voice in Parliament stays where it is. The cost is that an Indian’s vote goes on counting for different amounts in different states, and the gap keeps widening for as long as growth rates differ.
- Equal weight per person. Every MP represents roughly the same number of people, for the first time in India’s history. The cost is that Tamil Nadu’s share falls to about 6%, and states are effectively rebased on demographic outcomes they cannot now change.
There is no version that delivers both. That is not a drafting failure, it is arithmetic.
If seats follow population, House size makes no difference
Set the uniform-increase idea aside for a moment, because everything in this section assumes seats are shared out by population, which is what the bills as drafted require.
Tamil Nadu is 5.96% of India’s people. It holds 7.18% of the seats. That 1.22-point gap is what fifty years of a frozen census bought: Tamil Nadu’s population grew slower than the country’s, and its seat count did not adjust.
Now look at what happens to that share as the House grows.
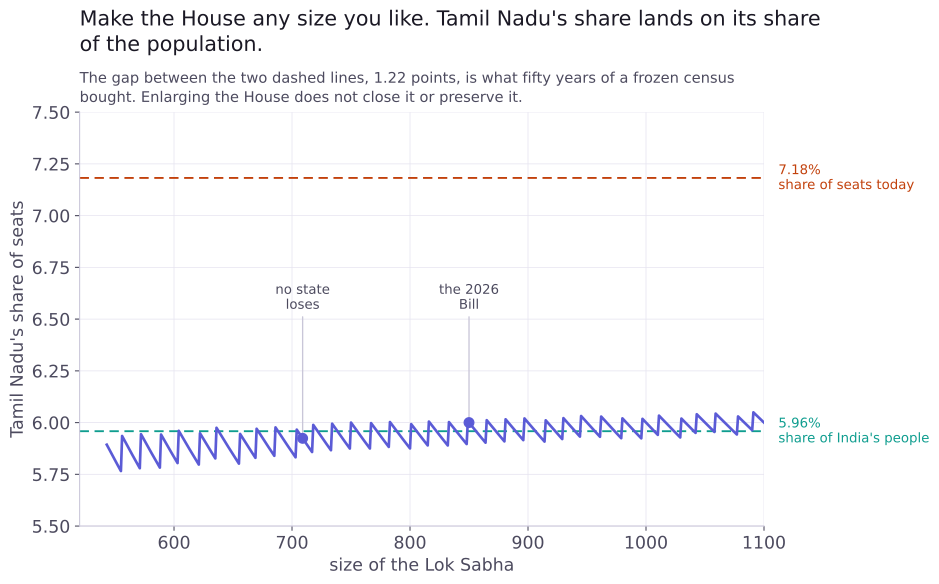
It lands on about 6% and stays there. At 709, at 850, at 1,100. That is not a quirk of any particular proposal. It is what proportional allocation means: each state’s share converges on its share of the population, and the size of the House does not enter into it.
PRS puts the same point in one sentence:
The change in the relative seat share will be maintained even if the total seats in Lok Sabha is increased.
So enlarging Parliament changes one thing and not the other. It converts an absolute loss into an absolute gain. It does nothing to the proportion.
That is worth being precise about, because both sides of the argument have used the ambiguity. “Tamil Nadu will lose seats” is false if the House grows. “Tamil Nadu loses nothing” is false too, as long as seats are shared out by population, because share is what determines influence in a vote.
The only way to hold the share is to stop allocating by population, which is exactly what version one does and exactly why it does not fit inside the current Bill.
Why this is happening to Tamil Nadu
Not because of the rounding rule, and not because of any paradox. Because of arithmetic that is easy to state.
Between 1971 and 2011, with the newer states folded back into their parents so the comparison is like for like:
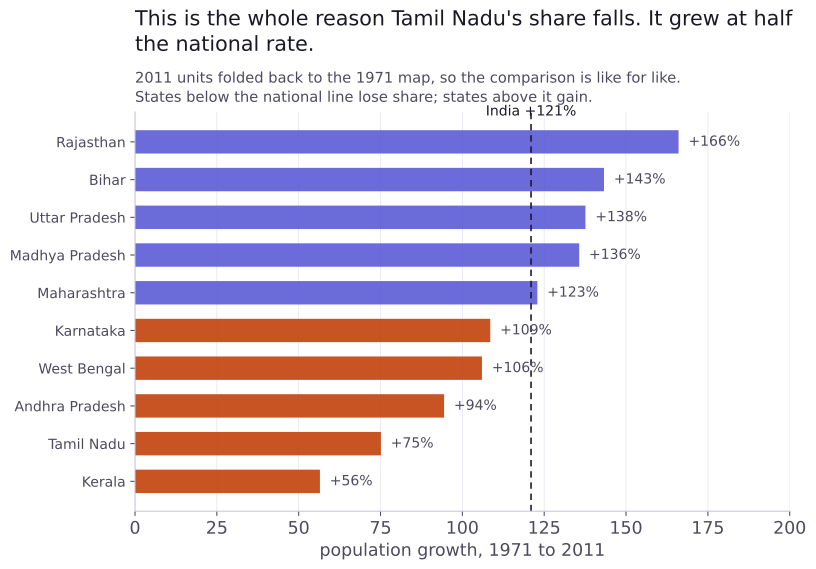
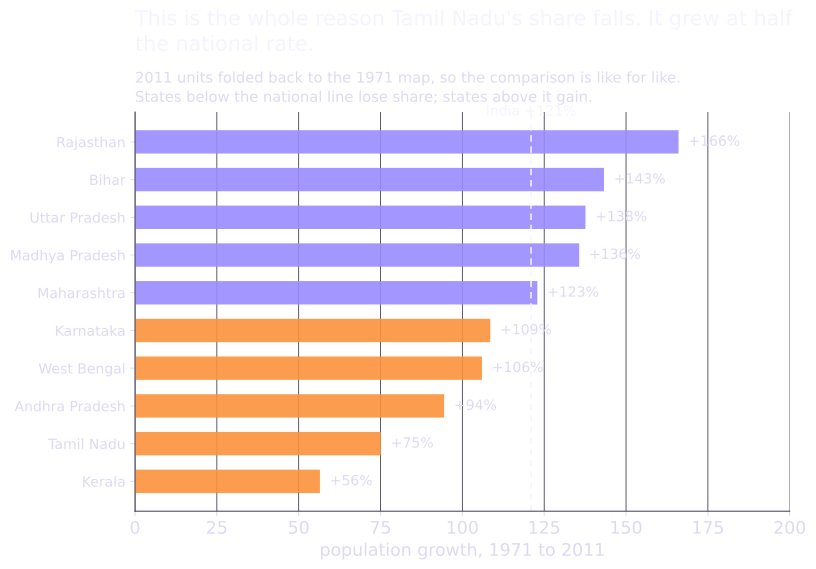
Tamil Nadu grew 75%. India grew 121%. Kerala grew 57%, the slowest of the large states. Rajasthan grew 166%, Bihar 143%, Uttar Pradesh 138%.
A state that grows at roughly half the national rate ends up with a smaller share of a population-based House. There is no trick in it, and no way of dividing seats by population avoids it, which is the subject of the longer piece this one comes from.
The uniform increase escapes it only by refusing the premise: it does not divide seats by population at all.
The argument Tamil Nadu rarely makes
There is a fact in Tamil Nadu’s favour that almost never appears in the coverage, and it is about constituencies rather than share.
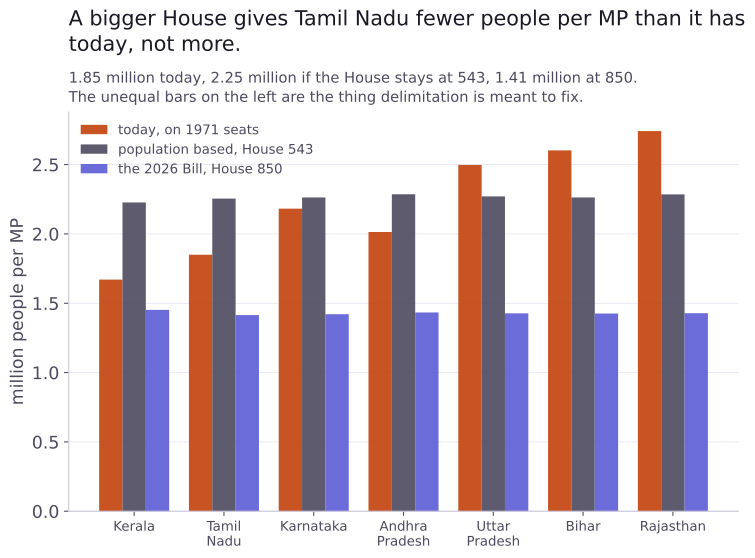
A Tamil Nadu MP today represents about 1.85 million people. If the House stays at 543 and seats are recomputed, that rises to 2.25 million, because Tamil Nadu has fewer MPs for the same population. But if the House grows to 850, it falls to 1.41 million.
A bigger Parliament gives Tamil Nadu smaller constituencies than it has now, not larger ones. Every large state converges on roughly 1.4 million people per MP, which is the closest India would have come to equal representation in its history. Those figures use 2011 population, so they are a floor; the real numbers in 2026 are higher everywhere.
The arguments, at their strongest
I am not going to tell you which side is right. Here is what each would say if it were putting its own case well.
For enlarging and sharing by population. No state loses a seat, so nothing has to be taken from anyone and the change is politically survivable. Tamil Nadu gets 12 more MPs and smaller constituencies. The under-representation of the northern states is real and has festered for fifty years: Uttar Pradesh goes from 80 to 140 under the Bill. A vote in Rajasthan currently counts for a good deal less than a vote in Kerala, which is hard to defend on any democratic principle. And the freeze cannot run indefinitely without the distortion compounding.
Against it. Share is what decides votes, and the Bill concedes the share while protecting the count, which is the symbol rather than the substance. PRS notes structural effects that have nothing to do with region: the Lok Sabha to Rajya Sabha ratio moves from 2.2:1 to 3.3:1, weakening the Council of States in presidential elections and joint sittings; the cap on the Council of Ministers is 15% of the House, so it rises from 81 to 122; and each MP gets less floor time, since questions are balloted. The Bill also lets Parliament choose which census to use by simple majority, replacing a constitutional rule with a political one.
For the uniform increase. It is the only proposal on the table that leaves the federal balance where it is, and federations routinely decline to allocate power strictly by headcount: the Rajya Sabha was meant to do this job in India and does not, because its seats also track population. A state that met a national policy objective should not have its parliamentary weight cut for having met it. Everyone still gets a smaller constituency than they have today, so nobody is worse off in absolute terms.
Against the uniform increase. It freezes the 1971 distortion permanently rather than for another twenty-five years, and does so at the moment the freeze was due to end. It cannot be done under article 81(2) as written, so it needs a larger constitutional change than the one Parliament has already rejected, and no draft of it has been published so far as I can find. It leaves an Indian’s vote worth different amounts in different states indefinitely. And because the ratio it locks in keeps drifting, the same argument returns at the next census with a wider gap to defend.
And the argument that is really about something else. Tamil Nadu’s case is often put as reward and punishment: the state did what national policy asked on family planning and is being penalised for succeeding. That is a claim about fairness between states, not about arithmetic, and no seat formula settles it. The measures that would address it directly, a reformed Rajya Sabha with fixed state representation, or delinking fiscal devolution from population, are in neither version.
Try it yourself
Every figure above is reproducible. The calculator lets you set the census, the House size and the rounding method, switch the six-million floor and the carve-out on and off, and see all 35 states and union territories at once.
It covers every row in the table except the uniform increase, which is not an allocation at all: that one is the 2008 seat table multiplied by 1.5, and you can check it with a calculator on the back of an envelope.
Interactive Run it for yourself Set the House to 850 and watch Tamil Nadu go to 51. Set it back to 543 and watch it fall to 32. Switch the method to Webster and see how little changes.Released under CC BY 4.0. Suggested citation: Anand Raj, “How many Lok Sabha seats will Tamil Nadu get?” ndranandraj.com, August 2026.