In March 1963, a Delimitation Commission published a notification in the Gazette of India explaining how it had divided the Lok Sabha among the states. Buried in it is this:
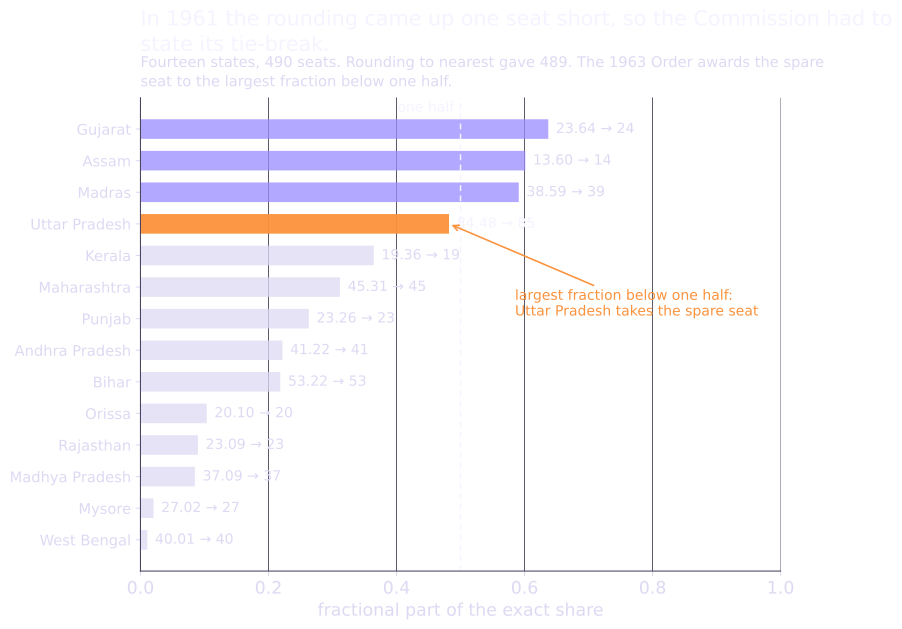
“The figures in the third column have been calculated to the second decimal place and then rounded off to the nearest integer, except in the case of Uttar Pradesh where 84.48 has been rounded off to 85 in order to bring up the total to 490. This State having the largest fraction less than one-half gets the benefit.”
That is the whole rule. Divide, round to the nearest whole number, and if the total comes up short, the state with the largest fraction below one half gets the spare seat.
It reads like clerical housekeeping. It is not. That sentence takes a side in a mathematical argument that was already fifty years old when it was written, and the Commission gives no sign of knowing the argument existed. The rule it chose has a name, a documented history of going wrong, and a theorem attached to it explaining exactly what India gave up by choosing it.
It also has one consequence I have not found anyone looking for in Indian numbers, and another that is widely assumed to be there and is not. Both are further down.
Interactive Run the arithmetic yourself Pick a census, a House size and a rounding method, switch the six-million floor and the carve-out on and off, and watch every state's seats move. Computed in your browser from published census counts.Whole seats, fractional people
Start with the difficulty, because the difficulty is the entire subject.
A state’s fair share of the Lok Sabha is its population divided by the country’s, multiplied by the number of seats. That number is almost never a whole number. Tamil Nadu’s share in the 1971 exercise was 39.4826 seats. You cannot send 0.4826 of an MP to Delhi.
So the fraction has to go somewhere. Round up and Tamil Nadu gains at somebody’s expense. Round down and it loses. Either way somebody is over-represented, and the rule you pick decides who.
There are many such rules, argued about since the first United States census in 1790, and the argument produced George Washington’s first use of the presidential veto. Before naming any of them, what do we want from one?
- Fair share. Every state should end up with either its exact share rounded down or its exact share rounded up. Never further off than that. Mathematicians call this satisfying quota.
- No punishment for a bigger House. If Parliament adds seats, no state should end up with fewer than before. This is house monotonicity, and failing it is called the Alabama paradox.
- No punishment for growth. If your state grows faster than mine, you should not lose a seat to me. This is population monotonicity, and failing it is the population paradox.
All three sound like minimum requirements. Hold on to that thought.
What India actually does
Take the 1971 exercise, which produced the seat allocation still in force today.
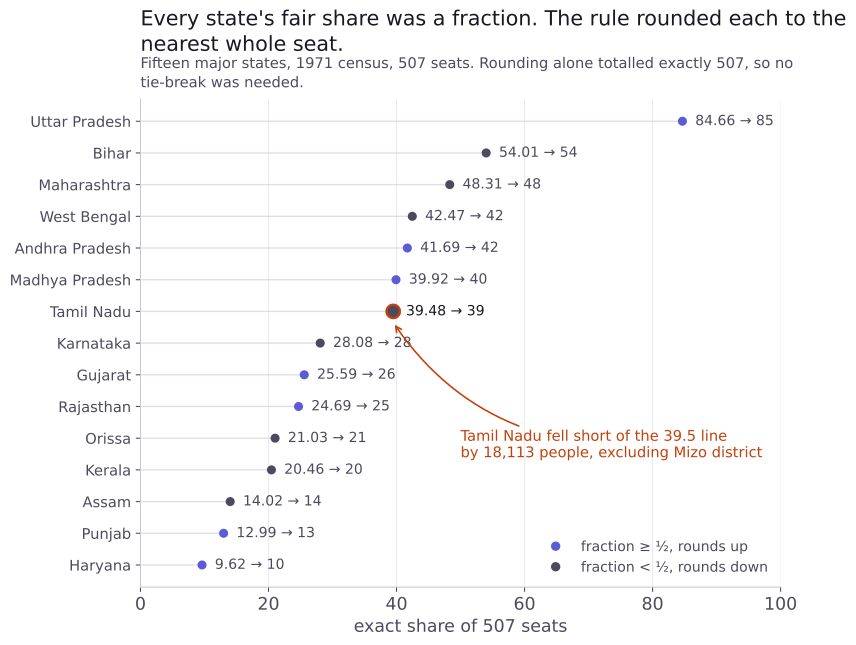
Fifteen states were in the proportional pool. Their combined population was 529,042,059 and they were allotted 507 seats between them, which is 1,043,475.46 people per seat. Divide each state by that number, round each result to the nearest whole number, and add them up. Every figure in this section is reproducible in the seat calculator, which runs the same arithmetic in your browser.
You get exactly 507. No adjustment needed. And the fifteen numbers match the Delimitation Commission’s published table, state for state.
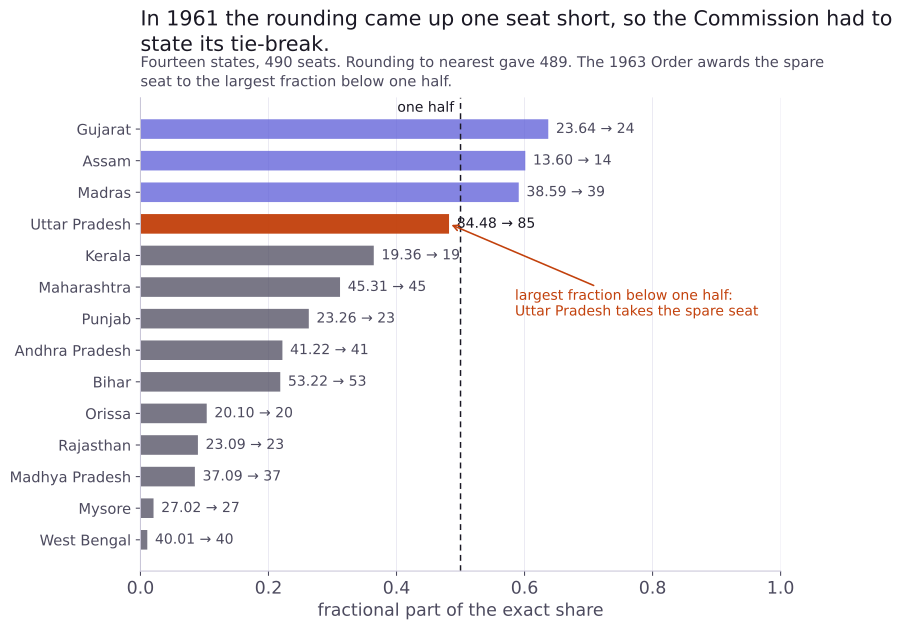
The 1961 exercise is the more instructive one, because there the rounding did not come out clean. Fourteen states, 427,732,685 people, 490 seats, which is 872,924 per seat. Round each state to the nearest whole number and the total is 489. One short.
That is why the Order states its tie-break: Uttar Pradesh’s exact share was 84.48, the largest fraction below one half anywhere in the table, so Uttar Pradesh got the spare seat.
In 1971 the rounding landed exactly on 507, so the question never came up, and the rule never needed restating.
Who is in the pool, and who is not
The fifteen states were not the whole country. States with fewer than six million people sit outside the proportional arithmetic entirely.
That is the proviso to article 81(2) of the Constitution, inserted by the Thirty-first Amendment in 1973. Its text does something quite specific: it disapplies the proportionality requirement to those states. It does not say they cannot lose seats. The standard gloss, including the one PRS uses, describes it as protecting small states from reduction, and that is the purpose the government stated in the Bill’s own Statement of Objects and Reasons. So the common description has the purpose right and the mechanism loose. Both halves are worth knowing, because they come apart in exactly the scenarios people are now arguing about.
On 1971 figures, exactly fifteen states exceeded six million, and they are exactly the fifteen that got the 507 seats. That looks like a coincidence and is not one: the Statement of Objects and Reasons uses the phrase “fifteen major States” itself and names the six smaller ones. Parliament drew a line around a list it had already written. A drafting artefact, not a discovery.
The same Amendment raised the states’ seat ceiling from 500 to 525, and says why: to “ensure that there is no reduction in the existing representation” of any state. The 1963 Commission had done the same a decade earlier, growing the House from 481 to 490 to soften losses to Uttar Pradesh, Andhra Pradesh and Madras.
Twice, when the arithmetic would have taken seats away from a state, India enlarged the House instead. That is not an accident of drafting. It is written into the record both times.
The rule has a name
Here is where the housekeeping notification turns into something else.
Divide by the average, round to the nearest whole number, and hand any shortfall to the largest remaining fractions. That procedure has a name. It is the Vinton method, also called the method of largest remainders. It apportioned the United States House of Representatives from 1850 to 1900.
The equivalence is not a resemblance, it is the same procedure described twice. Rounding to nearest gives a seat to precisely those states whose fractions are at least one half, which are precisely the states at the top of the remainder ranking. The spare seat then goes to the next state down that same ranking. Same output, every time.
The United States stopped using Vinton in 1900. The reason is the interesting part, and it comes later.
Two things need saying before we go on, and neither is optional.
India’s rule is not Webster. This matters because Webster is the method everyone who has looked at Indian delimitation has reached for, and it is a different animal. Webster adjusts the divisor until rounding to nearest happens to sum to the house size. India fixes the divisor at the plain average and repairs the total afterwards. They agree on the 1961 and 1971 data by coincidence, and their properties are opposite: Webster is immune to the Alabama paradox and can push a state more than a full seat away from its fair share, while India’s rule does the reverse.
The Order only covers half its own rule. It says what to do when rounding falls short. It says nothing about what to do when rounding overshoots the house size, which can happen just as easily. The Order is silent there. Everything below that involves house sizes India has never used is therefore a claim about a completion of the documented rule, mine rather than the Commission’s, and I have flagged every place where the overshoot branch is in play.
What it costs
In 1974 and again in 1980, Michel Balinski and Peyton Young proved two things about this whole family of rules. They are short enough to state plainly.
First: no divisor method satisfies quota. Pick any people-per-seat figure and any consistent rounding rule, adjust the divisor however you like, and there will be populations for which some state ends up further than a whole seat from its exact share. Of the five classical divisor methods, only one never overshoots a state’s fair share and only one never undershoots it. None does both.
Second: no method that satisfies quota can be population monotone. If your rule guarantees every state a seat count within one of its exact share, then there is some pattern of growth for which it takes a seat away from a faster-growing state and hands it to a slower-growing one.
The second result carries scope conditions: at least four states, and enough seats relative to the number of states. India clears them comfortably, with twenty states and a House in the hundreds, but a result quoted without its conditions is a result waiting to be misapplied.
Put them together and you get the choice India faced without knowing it faced one.
That gives us the conclusion about India by deduction rather than by analogy. India’s rule assigns every state its share rounded down or rounded up, so it satisfies quota. No method that satisfies quota is population monotone. Therefore India’s rule is not population monotone, and no amount of care in applying it can change that.
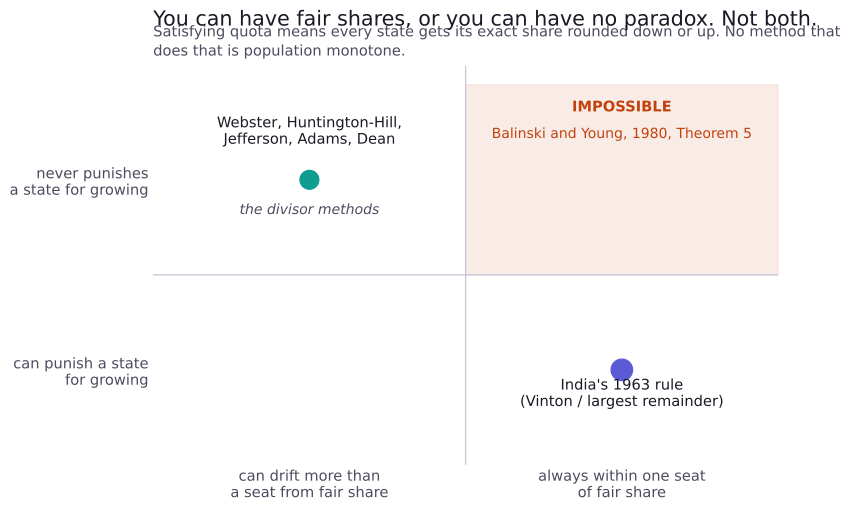
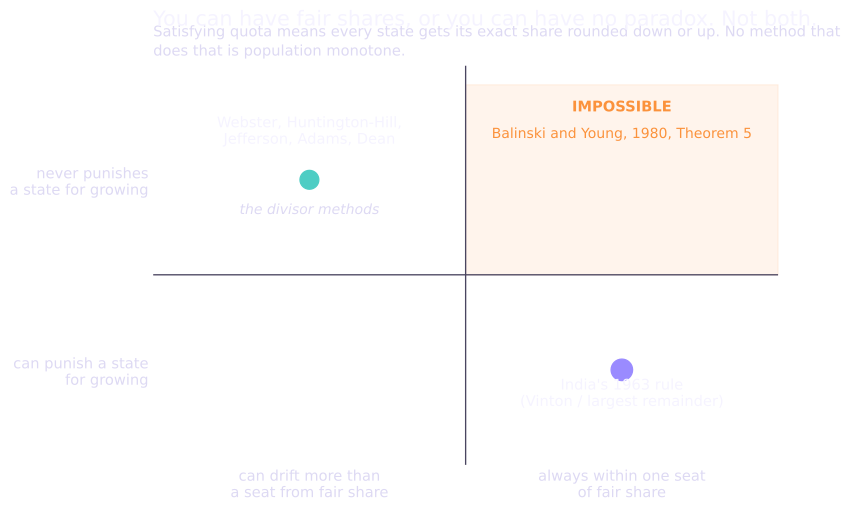
One phrase to avoid, because it is false and it is everywhere: no method is “free of paradoxes”. A method exists that satisfies quota and is immune to the Alabama paradox at the same time. It is population monotonicity specifically that cannot be bought. Name the paradox you mean.
Does any of it actually bite?
Theorems say what is possible. They do not say what happens on real numbers. So I looked.
The Alabama paradox: yes
The Alabama paradox is named for the 1880 US census, when Alabama was found to hold 8 seats in a House of 299 and 7 seats in a House of 300. Adding a seat to the House took one away from Alabama. It is what ended Vinton’s run in the United States, which the US Census Bureau’s own history records as lasting from 1850 to 1900. Representative Littlefield of Maine put the general feeling well in 1901, after watching his state’s delegation move six times as the House grew from 383 to 400:
“God help the State of Maine when mathematics reach for her…”
When India’s stated 1963 procedure is extended mechanically to hypothetical House sizes it was never applied to, the same thing happens. How often depends on how strictly you read the Order, and the honest answer is three numbers rather than one.
The Order works a single example and places exactly one spare seat. Sweeping from 543 to 1100, on the 2011 census and map, using the carve-out model named in the method note and comparing each House size against the one below it:
| How strictly you read the 1963 Order | Occasions a state loses a seat |
|---|---|
| Only House sizes needing no spare seat or one, the case the Order actually works | 11, across 6 states |
| Also House sizes needing two or more spares, where its stated principle extends by rank | 26, across 9 states |
| Also House sizes where rounding overshoots, where the Order states no principle at all, so the rule is extended furthest | 50, across 11 states |
The finding survives all three readings. The count does not. Take 11 as the strict figure. Both real exercises sit in that top row, so nothing historical moves: 1961 placed one spare seat and 1971 placed none.
The cleanest example, and one that sits in the strict top row under the carve-out model:
Uttarakhand holds 5 seats in a House of 546 and 4 seats in a House of 547. Over that step its exact share rises, from 4.4648 to 4.4734. It loses a seat because the House got bigger.
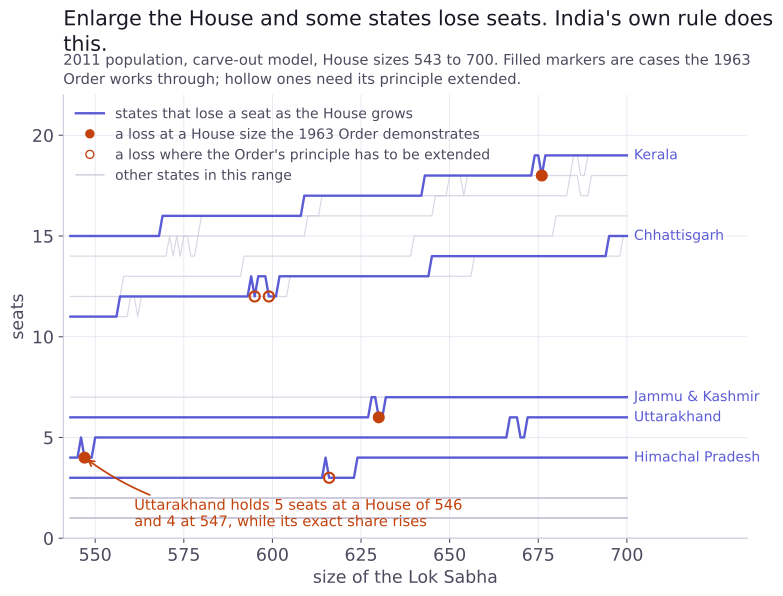
This is not a curiosity about a method India might adopt. It is a property of the rule the Commission wrote down and applied. It would become live if a future Commission enlarged the House and applied the same procedure with the same carve-out. That is a condition, not a certainty: nothing obliges a future Commission to use this rule, and the enlargement proposals I have seen all run through House sizes in this range.
The population paradox: no
Now the one most people expect to find.
Run 1971 against 2011 on comparable territory, at every House size from 15 to 1100, under the rule as documented, and the population paradox does not appear. Not at any House size in that range, and not at today’s 543 under either reading of the data.
That result belongs to the carve-out as much as to the rule, and the distinction matters. The states being apportioned are all large, and none of them ever sits near a rounding boundary in a way that flips. Widen the pool to all twenty-one states of the 1971 map with no six-million floor, and documented cases do appear, every one of them turning on a unit holding one seat or none. So the supported claim is the narrow one: with the carve-out holding the small units out of the pool, no case appears. Not that the rule cannot produce one.
That deserves a blunt statement, because it is the misreading this entire subject invites:
I should be honest about the strength of that finding, because it was the weakest evidence in this piece. It is a negative result produced by a search I wrote myself, and a bug in such a search returns “not found”, which is the answer being published. The failure would be invisible and self-confirming. I built a positive control that fires on a constructed case where the paradox is known to be present, ran both readings of an ambiguous territorial boundary and required them to agree, and published the full sweep.
It has now been reproduced independently. A second implementation was written from the 1963 Order and the raw census files alone, with no sight of my code, with its own positive control. It agrees: nothing on the documented branch over the apportioned states, nothing at 543 under any model or either reading, and it rediscovered the single undocumented-branch instance at the same pool size with the same pair of states. It also reproduced the 1976 allocation 15 out of 15 and the whole Phase 4 table, which is the check that matters most, since a reimplementation that agreed on the negative result while disagreeing on the positive ones would be worthless.
What it changed is the framing rather than the number: the pool dependence stated above, and one wording trap. The paradox is a faster-growing state losing a seat to a slower-growing one. Drop those last four words and the same sweep appears to show 142 cases, all of them artefacts of the looser sentence. Even so, read the result as “not found in this model” rather than “does not occur”.
The rounding rule is not the problem
Everything so far has been about the rule. Now the inversion, and it is the finding I did not expect when I started.
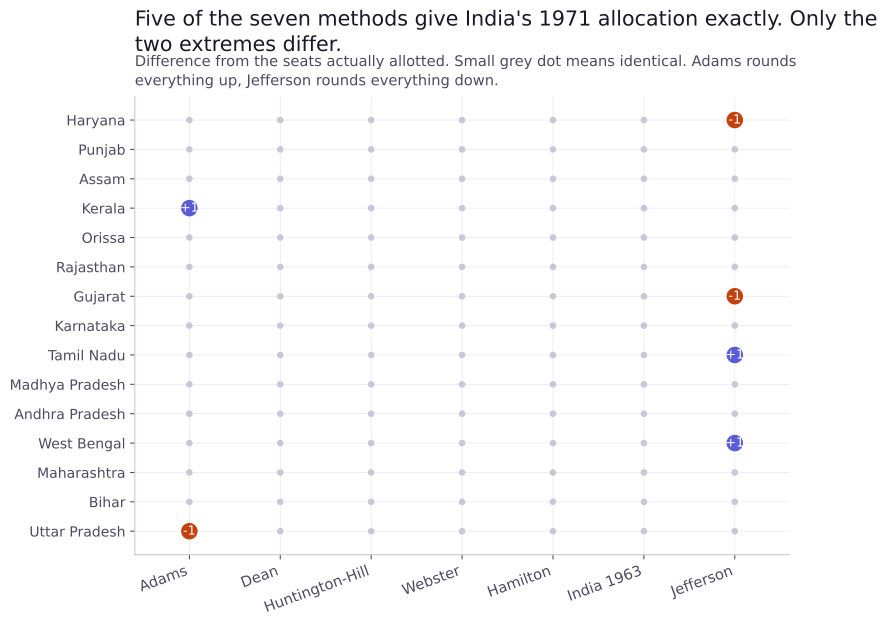
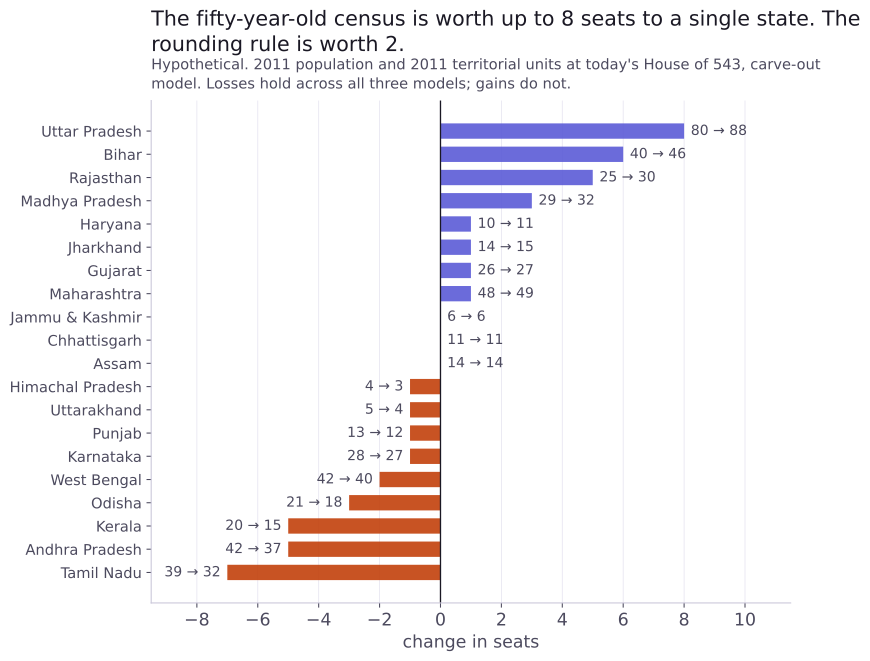
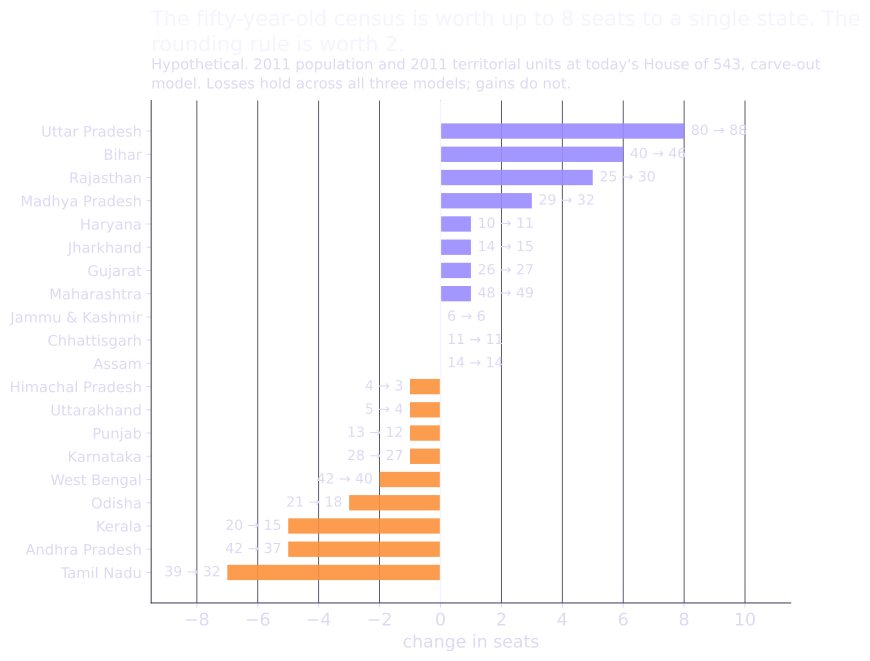
The choice of rounding method is worth at most 2 seats to any state, measured across seven methods within a fixed carve-out model. Adams, Dean, Huntington-Hill, Webster, Hamilton and India’s own rule mostly produce identical tables. Only the two extreme methods, which round everything down or everything up, differ much.
The fifty-year-old census is worth up to 8 seats to a single state.
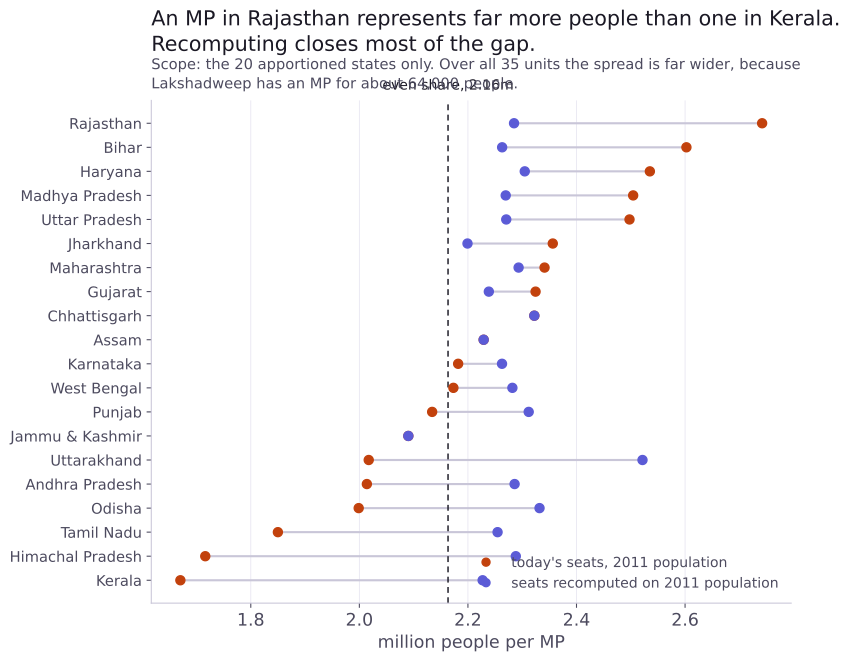
That is the whole story in one comparison. India’s allocation is based on the 1971 census, frozen first in 1976 and extended in 2002. Measured against 2011 population, the allocation in force is eight to twelve times worse than one computed today on the measures that look at the whole distribution: Loosemore-Hanby, the Gini of representation, and root-mean-square deviation from exact share.
Being precise about that matters, because it is not true of every measure. On the extremes it is much closer: the ratio between the best and worst represented state improves only from 1.64 to 1.21, and the least-represented state is actually slightly better off under the frozen allocation. The freeze is not uniformly worse. It is far worse at spreading states away from their fair shares, which is the thing that determines how many seats move.
Here is what moves, on 2011 population at today’s House of 543:
| State | Seats now | On 2011 population | Change |
|---|---|---|---|
| Tamil Nadu | 39 | 32 | -7 |
| Andhra Pradesh | 42 | 37 | -5 |
| Kerala | 20 | 15 | -5 |
| Odisha | 21 | 18 | -3 |
| West Bengal | 42 | 40 | -2 |
| Madhya Pradesh | 29 | 32 | +3 |
| Rajasthan | 25 | 30 | +5 |
| Bihar | 40 | 46 | +6 |
| Uttar Pradesh | 80 | 88 | +8 |
And the figure that frames the whole legislative question: under the carve-out model, the smallest House at which no state loses a seat against what it holds today is 709.
That is a different comparison from the paradox above, and the two are easy to confuse. The 709 measures every state against its current seats. The Alabama drops measure each House size against the one below it. Both are true at once: you can reach a House where nobody is worse off than today, and still pass House sizes on the way up at which some state briefly loses a seat.
Tamil Nadu, at the edge
One number, because it is the human end of the arithmetic.
In the 1971 exercise, Tamil Nadu’s exact share was 39.4826. The rounding boundary was 39.5. Tamil Nadu was 18,113 people below the line, in a state of forty-one million. A large housing colony’s worth of people, and the state rounded down to 39 instead of up to 40.
Two things about that number, and I am spelling them out because I got this sentence wrong three separate times before a reviewer caught it.
It is a margin, not a counterfactual. It is how far short of the boundary Tamil Nadu fell. It is not the answer to “how many more people would have won a fortieth seat”, and that question has no well-defined answer under India’s own rule. Adding people pushes the state over the line but also raises the national total, and the case that arises is the overshoot case the 1963 Order does not cover. Every attempt I made to compute “what it would have taken” produced an artefact of my own assumptions. If you want the nearest defensible version: with 19,644 more people Tamil Nadu’s share reaches 39.5, at which point the fifteen states round to 508 seats and you no longer have the House you started with.
It depends on a boundary reading. The 1971 census counts Mizo district inside Assam; by 1976 Mizoram was a separate union territory. Excluding it, which is the reading that matches the 1976 seat table, the margin is 18,113. On the census as printed it is 44,009. The seat allocation is identical either way. The margin is not.
What the debate gets wrong
Four things worth correcting, and I carried the first one myself for weeks.
848 is not a legislative number. The figure quoted everywhere as the size of an enlarged Lok Sabha comes from a 2019 Carnegie Endowment projection. The Constitution (131st Amendment) Bill of 2026 proposed a maximum of 850, with up to 815 from the states and 35 from the union territories. I used 848 myself for weeks before checking it against the bill.
The 2026 bills did not “all get voted down”. One did. On 17 April 2026 the Lok Sabha negatived the Constitution (131st Amendment) Bill, whose text as introduced carries the 815 and 35 maxima. Its two linked companion bills then became infructuous and were never taken up, as the Ministry of Parliamentary Affairs release records. Only one was actually voted on, and the distinction matters if you are counting votes.
A second number is circulating without provenance, and this one may not survive it. Alistair McMillan’s estimate of the House size at which no state loses is widely quoted as 668. His own published table says 647.
Carnegie is the origin, and it shows its working: it reports 668 “not adjusting the 21 seats constitutionally exempt from proportional representation”. Sum McMillan’s table row by row and the 21 proportional units hold 628, the 14 exempt units hold 19, and the total is 647, which is his own figure. And 647 plus 21 is 668. So 668 appears to be his total plus a set of exempt seats it already contained. That is an inference from two published tables, both of which you can check, and it is the likely reading rather than a certain one. Different census years and a different model are also in play, so quote whichever figure you prefer, but say whose it is and what it was computed on.
The cube root is a regularity, not a law. Assembly sizes across countries sit near the cube root of population, and India’s 2011 population gives about 1,066 against an actual House of 543. Write it as an empirical regularity, because the derivation is contested in print.
What others have found
This is not a new idea. Alistair McMillan applied the Webster method to Indian delimitation in the Economic and Political Weekly in 2000, and Patel and Sekher did the same in the Journal of Asian and African Studies in 2024. Both cite the same Balinski and Young work this piece leans on.
What I have not found is anyone who identified the rule stated in the 1963 Order and tested it against the allocations actually made. And one detail in the prior work is worth the detour.
In the footnote where McMillan sets out his method, he notes that using the plain quota and rounding the remainders does not add up to the right number of seats. He calls it a problem with the quota approach, mentions that fixes have been proposed, “such as allocating seats to the states with the largest remainders until all the seats have been filled”, and dismisses them as biased.
That is the 1963 Order, step for step. He describes it as a proposal, in a policy article aimed elsewhere, and comes within one sentence of noticing it has been Indian law since before he was writing. A near miss in an argument about something else, not an oversight, and the closest anyone has come.
One more thing. On 2001 data, in a different model from mine, McMillan gets Tamil Nadu falling from 39 seats to 32. On 2011 census data I get 39 to 32.
And the comparison I most want you to make. Carnegie’s 2019 paper computes the same no-state-loses figure I do, on the same 2011 census, and gets 718 against my 709. That gap is worth understanding rather than explaining away. They use the Webster method, a divisor rule, with Delhi inside a 21-unit pool and 21 seats held outside it. I use the rule the Commission actually documented, a quota rule, with 20 states in the pool and 26 seats held across 15 units. Two different rules and two different models, nine seats apart on a House of seven hundred. That is a small disagreement, and it is worth more than either number on its own: it says the answer is not very sensitive to the choices that look most arguable.
Interactive Check the 709 yourself The calculator does every model in this piece. Switch the method to Webster, move Delhi in or out of the pool, and watch the no-state-loses figure slide between the numbers Carnegie and I arrived at.What the Commission actually chose
The 1963 Commission had to turn fractions into whole seats, and no way of doing that is free of consequence. It produced a quota-respecting allocation: every state received either its exact share rounded down or its exact share rounded up, and never anything further away.
That is not the same as giving every state the seat count nearest to its share, and the article’s own worked example shows why. Uttar Pradesh’s 84.48 is nearer to 84 than to 85, and the rule gave it 85 to make the total come out. Quota is a guarantee about the range each state lands in, not about minimising any particular distance. The price of that guarantee, proved a decade later and a continent away, is that the arithmetic can behave strangely when the House grows.
That is a defensible trade, and plenty of people would make it. What is striking is that there is no sign anyone involved knew it was a trade. The Commission wrote down a procedure that seemed obvious, applied it, and moved on.
Be precise about what that means today. No statute or later Order adopts the method by name, so it is a documented historical procedure rather than a binding rule of Indian law. What is still in force is the allocation it produced.
The rule is not what is broken. The date is. And the question in front of Parliament is not really which method to use, because on Indian numbers the methods barely differ. It is what to do about fifty years of held breath, and whether to let the House grow rather than move seats between states, which is what India has quietly done every previous time the arithmetic got uncomfortable.
For anyone who wants to check the work, the method note has every source with a full citation, the three models and how much each one matters, what each test does and does not establish, and a log of the claims this project made and then withdrew.
Released under CC BY 4.0. Suggested citation: Anand Raj, “The rule India wrote down in 1963.” ndranandraj.com, August 2026.